Fed Funds Rate History by Month: Every Change from 2015 to October 2026
The federal funds target range is 3.75%–4.00% as of October 20, 2026. The FOMC raised it by 25 basis points on September 16, 2026, the first hike since July 2023. Below you’ll find every change since 2015 in one table, built from the Fed’s own data series rather than news recaps.
Where the Fed funds rate stands in October 2026
- Target range: 3.75%–4.00% (effective September 17, 2026).
- Vote: 12–0, according to the FOMC statement.
- Interest on reserve balances: raised to 3.90%; primary credit rate 4.00% (Fed implementation note).
- Effective fed funds rate (EFFR): 3.88% on recent daily prints (H.15, week of October 12, 2026).
There is no FOMC meeting in October 2026, so the range stays where it is until the next scheduled decision. Check the live month-by-month Fed rate tracker for the latest status.
Chart: the target range since 2015
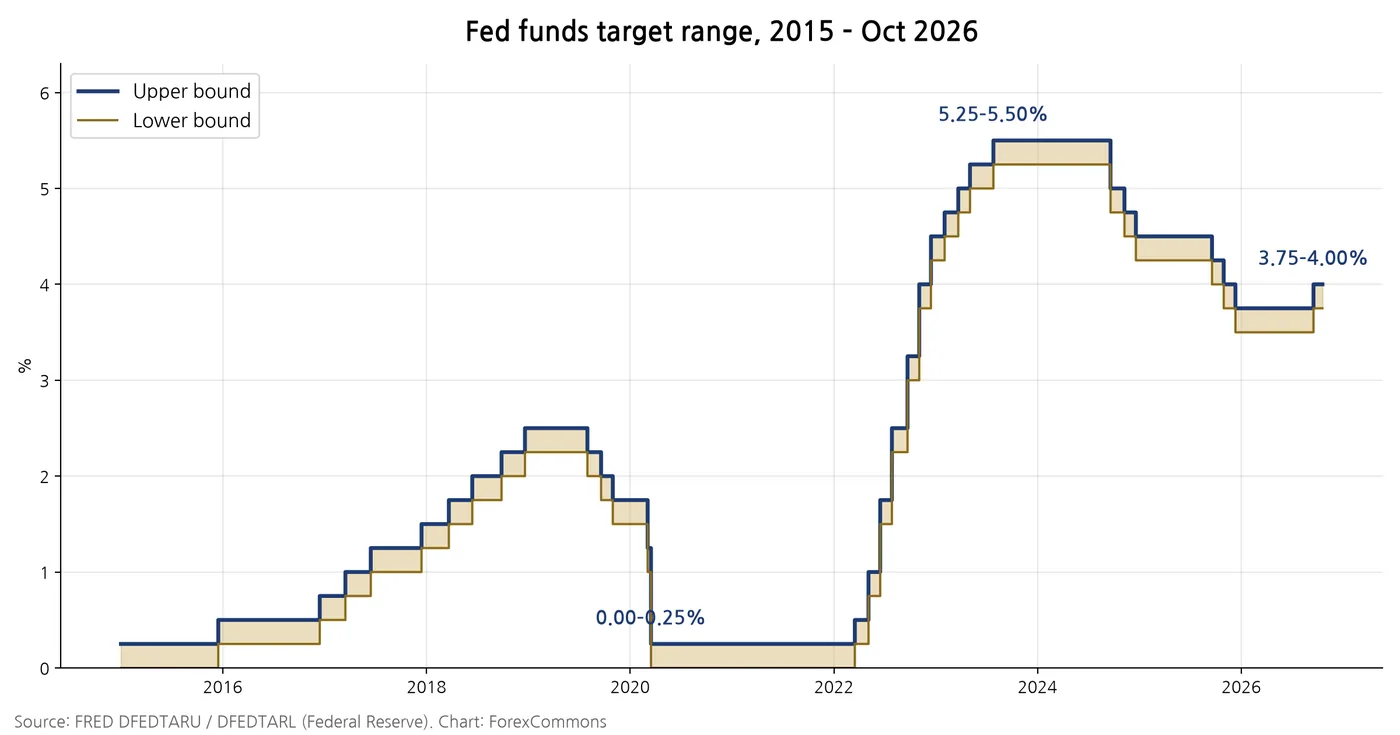
Three things jump out: the long 0–0.25% floor from March 2020 to March 2022, the fastest hiking cycle in decades (525bp between March 2022 and July 2023), and the cutting run from September 2024 to December 2025 that was partly reversed in September 2026.
Every Fed rate change since 2015 (table)
Dates are effective dates from FRED (the day after the FOMC announcement). Newest first.
| Effective date | Target range | Change |
|---|---|---|
| 2026-09-17 | 3.75–4.00% | ▲ +25bp |
| 2025-12-11 | 3.50–3.75% | ▼ -25bp |
| 2025-10-30 | 3.75–4.00% | ▼ -25bp |
| 2025-09-18 | 4.00–4.25% | ▼ -25bp |
| 2024-12-19 | 4.25–4.50% | ▼ -25bp |
| 2024-11-08 | 4.50–4.75% | ▼ -25bp |
| 2024-09-19 | 4.75–5.00% | ▼ -50bp |
| 2023-07-27 | 5.25–5.50% | ▲ +25bp |
| 2023-05-04 | 5.00–5.25% | ▲ +25bp |
| 2023-03-23 | 4.75–5.00% | ▲ +25bp |
| 2023-02-02 | 4.50–4.75% | ▲ +25bp |
| 2022-12-15 | 4.25–4.50% | ▲ +50bp |
| 2022-11-03 | 3.75–4.00% | ▲ +75bp |
| 2022-09-22 | 3.00–3.25% | ▲ +75bp |
| 2022-07-28 | 2.25–2.50% | ▲ +75bp |
| 2022-06-16 | 1.50–1.75% | ▲ +75bp |
| 2022-05-05 | 0.75–1.00% | ▲ +50bp |
| 2022-03-17 | 0.25–0.50% | ▲ +25bp |
| 2020-03-16 | 0.00–0.25% | ▼ -100bp |
| 2020-03-04 | 1.00–1.25% | ▼ -50bp |
| 2019-10-31 | 1.50–1.75% | ▼ -25bp |
| 2019-09-19 | 1.75–2.00% | ▼ -25bp |
| 2019-08-01 | 2.00–2.25% | ▼ -25bp |
| 2018-12-20 | 2.25–2.50% | ▲ +25bp |
| 2018-09-27 | 2.00–2.25% | ▲ +25bp |
| 2018-06-14 | 1.75–2.00% | ▲ +25bp |
| 2018-03-22 | 1.50–1.75% | ▲ +25bp |
| 2017-12-14 | 1.25–1.50% | ▲ +25bp |
| 2017-06-15 | 1.00–1.25% | ▲ +25bp |
| 2017-03-16 | 0.75–1.00% | ▲ +25bp |
| 2016-12-14 | 0.50–0.75% | ▲ +25bp |
| 2015-12-16 | 0.25–0.50% | ▲ +25bp |
2026 monthly effective fed funds rate
The target range is a corridor; the effective rate is what banks actually paid on average. Monthly averages from the Fed’s H.15 release:
| 2026 | Jan | Feb | Mar | Apr | May | Jun | Jul | Aug | Sep |
|---|---|---|---|---|---|---|---|---|---|
| EFFR % | 3.64 | 3.64 | 3.64 | 3.64 | 3.63 | 3.63 | 3.63 | 3.63 | 3.75 |
How to read the history like a trader
Cycles matter more than single moves
A single 25bp change rarely moves markets on its own; what moves the dollar and gold is a change in the expected path. September 2026 mattered because it flipped the direction after six cuts.
Upper bound vs. effective rate
Many charts online plot only the effective rate (FRED series FEDFUNDS). That’s fine for long history, but for decision dates use the upper and lower bounds (DFEDTARU / DFEDTARL), which is what this page uses.
Where to watch next
Our Fed Chair remarks timeline collects what was actually said at each press conference, and the economic calendar lists upcoming CPI and jobs releases that feed the next decision.
Sources and method
Data: FRED DFEDTARU and DFEDTARL, Fed H.15, and the September 16, 2026 FOMC statement. Downloaded October 20, 2026. Information only — not investment advice.
Frequently asked questions
What is the current Fed funds rate?
As of October 20, 2026 the target range is 3.75%–4.00%, set at the September 16, 2026 FOMC meeting and effective September 17.
When did the Fed last raise rates?
On September 16, 2026, by 25 basis points. Before that, the last hike was in July 2023, when the range reached 5.25%–5.50%.
What was the highest Fed funds rate since 2015?
5.25%–5.50%, held from July 2023 until the first cut in September 2024.
Why do dates differ by one day between sources?
The FOMC announces a decision on the meeting day; the new range takes effect the next day. FRED records the effective date.
Where can I download Fed funds rate history?
FRED offers free CSV downloads for DFEDTARU (upper bound), DFEDTARL (lower bound) and FEDFUNDS (monthly effective rate).